How do I interpret a camera histogram for brightfield?
![]() Video Tool Panels: Camera Histogram
Video Tool Panels: Camera Histogram
- If the live image on your screen does not match the one in your eyepieces, try to adjust the white balance.
- If the live image matches the image in your eyepieces, examine the gray part of the camera histogram to assess the quality of the image.
Examples:
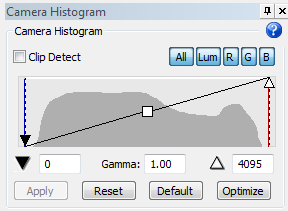
|
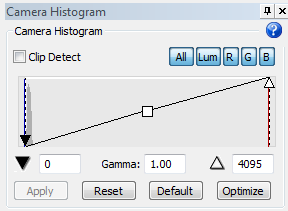
This is an ideal histogram for most types of brightfield data. The dynamic range is nearly the entire range of the camera. |
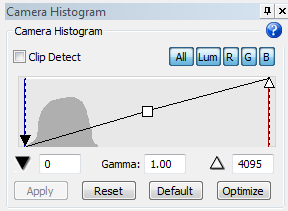
|
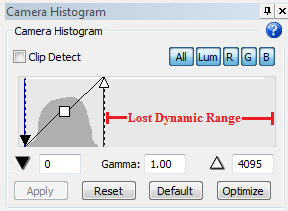
The dynamic range is too low.
To improve the dynamic range, you may move the white point slider to the left (see figure on the left).
|
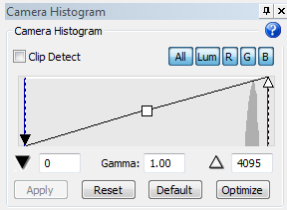
|
Background image only
Good example for the acquisition of a brightfield background image -- Virtual Tissue (slide scanning): Acquiring a background Image (Brightfield)
This histogram indicates the presence of dust or other artifacts in the background image.
|
|
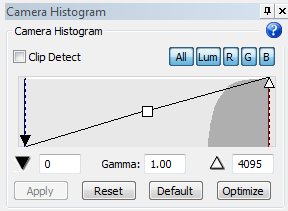
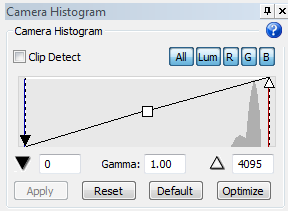
The red line on the right of the graph indicates saturation. If the image is completely saturated, the function (represented in gray) is not visible; only the red line appears. If enabled, Clip Detect will show most of the image as red.
The blue line on the left indicates that the signal is below the range. |
|
This histogram suggests that the light source is not sufficient the camera. To correct this, examine an image in the eyepieces.
The blue line on the left may not appear depending on the sensitivity of the camera. |
Stereo Investigator 11 | MBF Bioscience Support Center | Downloads